初等部
G2 – Survey Graph
第2学年 – アンケートグラフ
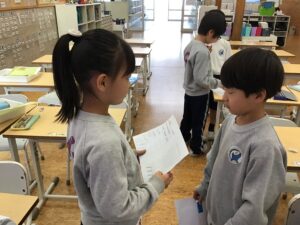
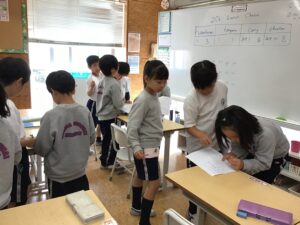
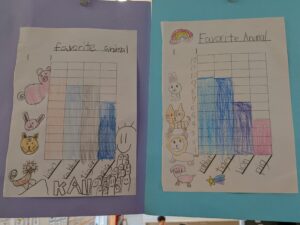
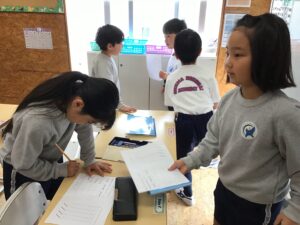
2年生たちは、算数の授業で「ひょうとグラフ」について学んでいます。子どもたちはそれぞれ、クラスメートに尋ねる質問を考えました。そして、その質問に対する答えとして4つの選択肢を用意し、アンケートを作成しました。児童たちは回答を記録する際、数え棒(tally marks)の使い方を練習しました。データを収集した後、各児童はそのデータを使って棒グラフを作りました。活動終了後、子どもたちは完成したグラフをクラスに示し、データについて説明しました。グラフについて学んだだけでなく、クラスメートの好き嫌いの傾向についても少し知ることができました!
G2 – Survey Graph
Grade 2 students are learning about tables and graphs in math class. The students each thought of a question that they could ask their classmates. They made a survey by giving four choices for the answer to their question. The students practiced using tally marks when they recorded the answers. After collecting the data, each student used the data to create a bar graph. After the activity, students showed their finished graphs and explained their data to the class. Students learned about graphs, but they also learned a little bit about the likes and dislikes of their classmates!
![]()